
of returned fashion ends up in landfill. Not resold. Not donated. Destroyed.
recovered on every dollar returned. Scanned, graded, rerouted, resold — before the next shift.
Left: what doing nothing costs.
Right: what switching proves.
days — industry average return-to-shelf
Average return-to-resale cycle time
From USPS scan to relisted SKU — graded, photographed, priced, live.
written off — same volume, traditional 3PL
Recovered revenue, single client, Q3 2025
Mid-market footwear brand. 31% return rate. Zero additional headcount.
cents on dollar — typical liquidation exit
Higher resale rate vs. liquidation
Secondary channel placement beats bulk liquidators every quarter.
A mid-market footwear brand recovered $4.2M in Q3.
31% return rate. 180,000 units processed. Zero additional warehouse headcount. Before Reflow, their returns team was manually sorting, emailing liquidators, and writing off 60% of inventory value every season.
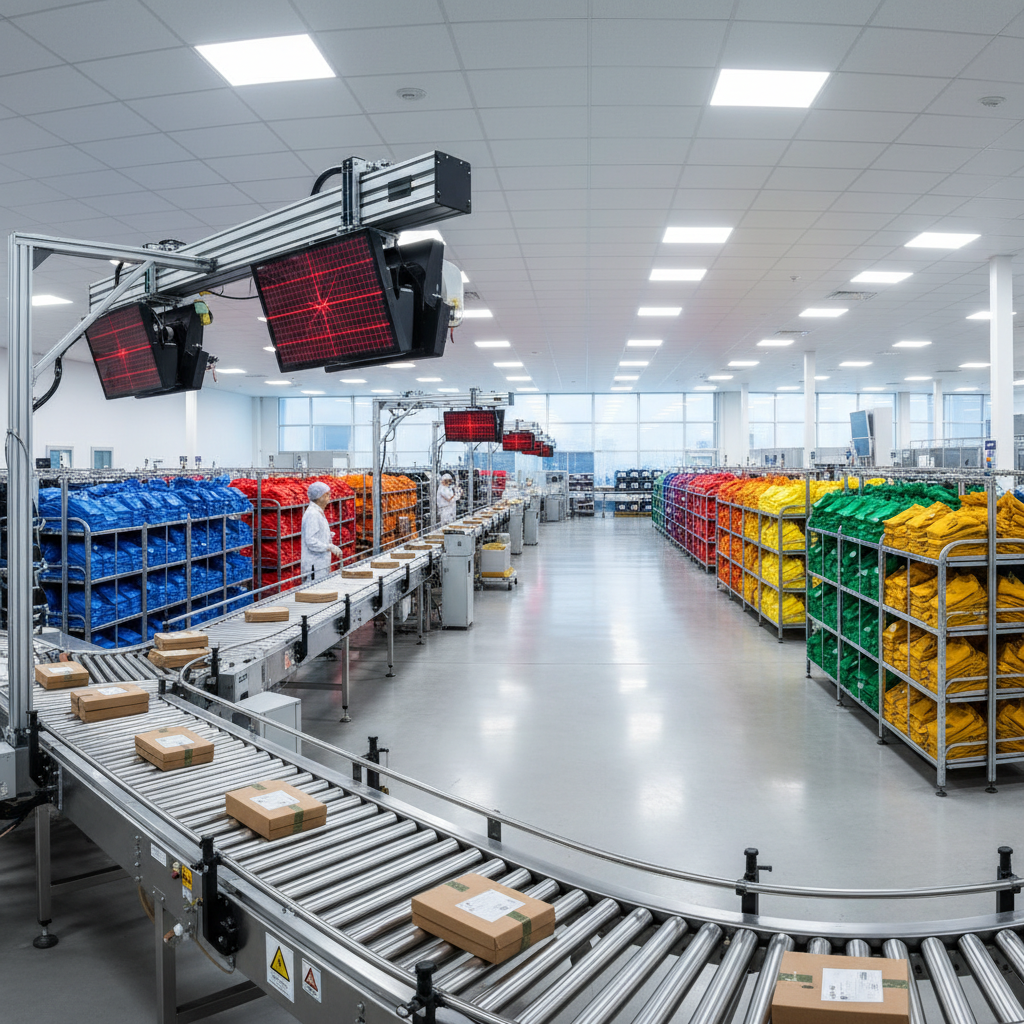
After onboarding: every parcel gets scanned and graded at intake. Wearable condition routes to secondary marketplace. Near-new condition routes back to primary D2C with a 15% discount flag. Damaged routes to parts/repair. Nothing goes to landfill without exhausting every channel first.
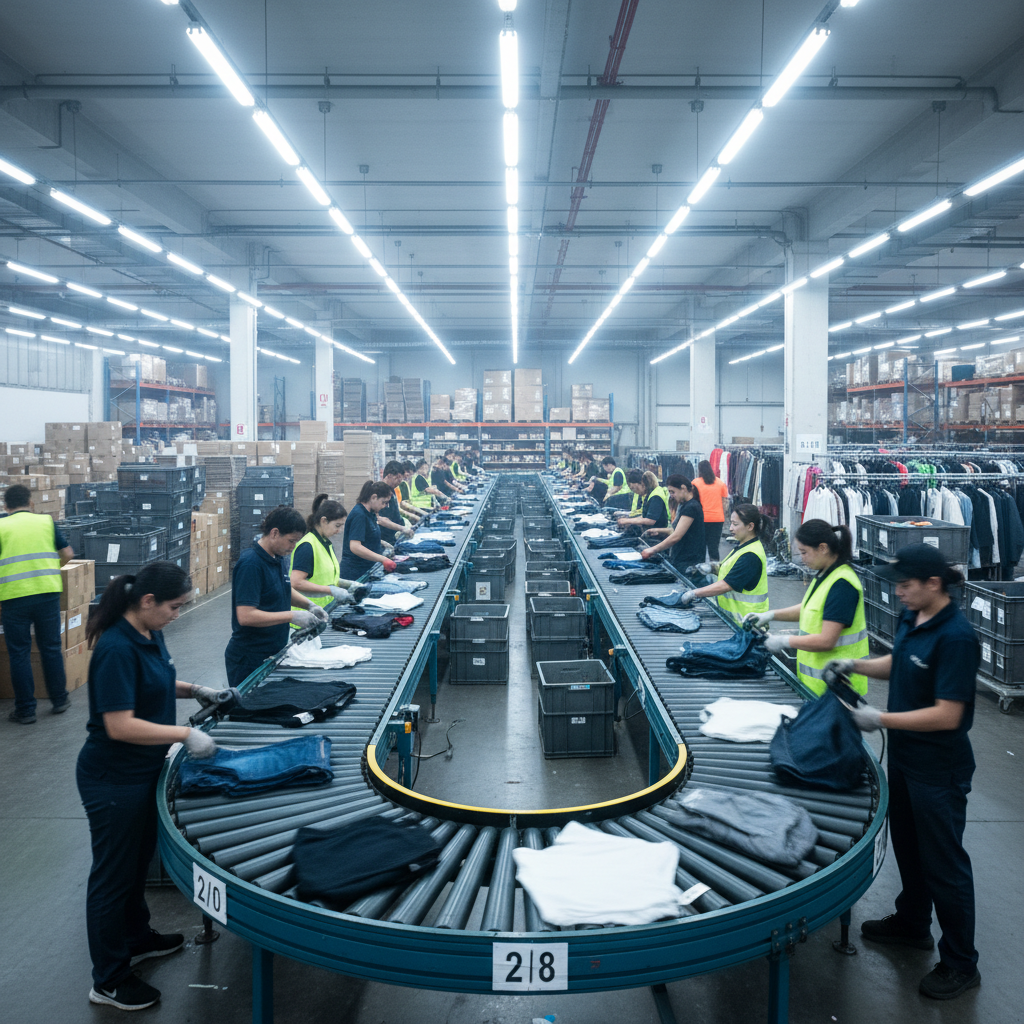
Traditional 3PL vs. Reflow
Eight metrics. Same return volume. Wildly different outcomes.
See exactly where your current process loses money.
Run My Returns Audit
We analyze your return volume, current process, and product mix. You get a custom recovery projection in 48 hours — no commitment, no sales call unless you want one.
Fashion Returns
Benchmark Report
- →Return rates by category (apparel, footwear, accessories)
- →Recovery benchmarks across 120+ fashion brands
- →Cost-per-return breakdown by channel
- →Sustainability compliance requirements 2025–2026
47-page PDF · No spam · Unsubscribe anytime